Ask AI on The Internet
Question: Determination of Cu2+ concentration by making use of a UV/vis spectrophotometer PRACTICAL WAS CONDUCTED THE UNKNOWN CONCENTRATION FROM ABSORBANCE 0.6701 WAS FOUND FROM THE STANDARD CURVE TO BE 1.78 PPM THE SLOPE WHICH IS THE MOLAR ABSORPTIVITY WAS FOUND TO BE 0.1998 , THE R^2 WAS FOUND TO BE 0.9733 DISCUSS THE RESULTS AND CONCLUDE
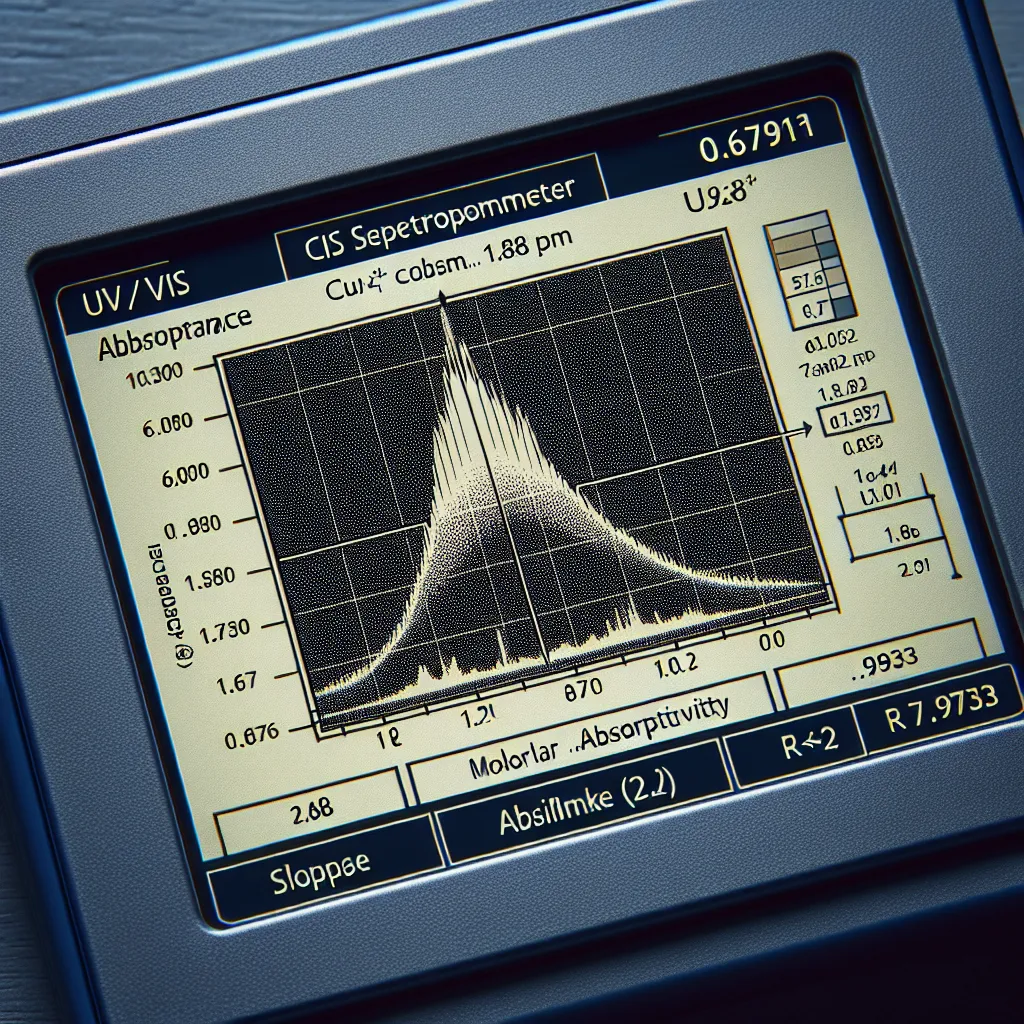
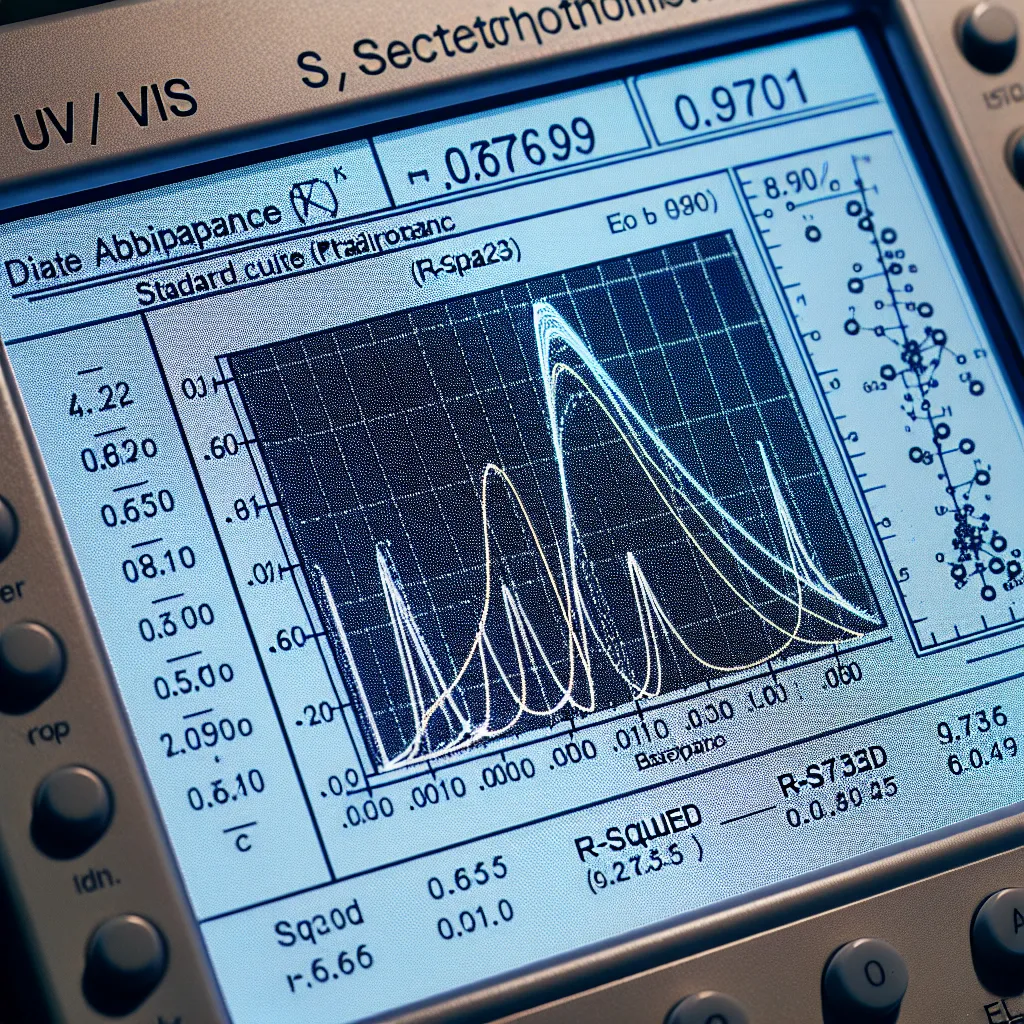
When you performed the practical to determine the concentration of Cu²⁺ using a UV/vis spectrophotometer, you obtained an absorbance of 0.6701 for the unknown sample. From the standard curve, you identified that this absorbance corresponds to a Cu²⁺ concentration of 1.78 ppm. ### Analysis and Discussion: 1. **Molar Absorptivity (Slope):** - The slope of the standard curve (molar absorptivity, ε) was 0.1998. This value indicates the absorbance per path length (in cm) and per concentration unit (in ppm) of Cu²⁺ in the solution. - Molar absorptivity is fundamental in Beer's Law (A = εcl), where: - \( A \) is the absorbance, - \( ε \) is the molar absorptivity, - \( c \) is the concentration, - \( l \) is the path length of the cuvette (usually 1 cm). 2. **Correlation Coefficient (R²):** - An R² value of 0.9733 indicates a strong positive linear relationship between absorbance and concentration in the standard curve. - The closer the R² value is to 1, the better the fit of the data to the linear model. A value of 0.9733 suggests that 97.33% of the variation in absorbance can be explained by the variation in Cu²⁺ concentration, indicating a reliable standard curve. 3. **Quality of the Standard Curve:** - The high R² value confirms that the methodology you used to prepare and measure the standard solutions was precise and consistent. - The linearity of the standard curve validates the use of Beer's Law within the concentration range studied. ### Conclusion: The determination of Cu²⁺ concentration using UV/vis spectrophotometry has yielded satisfactory results with an unknown concentration found to be 1.78 ppm. The high correlation coefficient (R² = 0.9733) and a consistent molar absorptivity (0.1998) validate the accuracy and reliability of the measurements and the established standard curve. The data suggests that: - The spectrophotometer and experimental procedure are both reliable for determining Cu²⁺ concentration within the studied range. - The unknown sample, with an absorbance of 0.6701, has been accurately analyzed against the standard curve, providing a concentration of 1.78 ppm. In summary, the experiment was successful, yielding valid and precise results for the concentration of Cu²⁺ in the unknown sample.
Think your answer is better than the AI's? Post it below.
Other Most Relevant Posts:
Question Tags
If you want your question answered by an AI, click here.





Post your own comment: