Ask AI on The Internet
Question: Meadowland Farms is a beacon of sustainability and quality in the dairy industry. Through meticulous management, doubling the farm’s output precisely doubles the cost of production, ensuring efficiency in resource utilisation. Identify the shape of the Meadowland Farm’s long run average cost curve. Provide a suitable diagram with your answer. Fully label your graph. (2+8 = 10 Marks
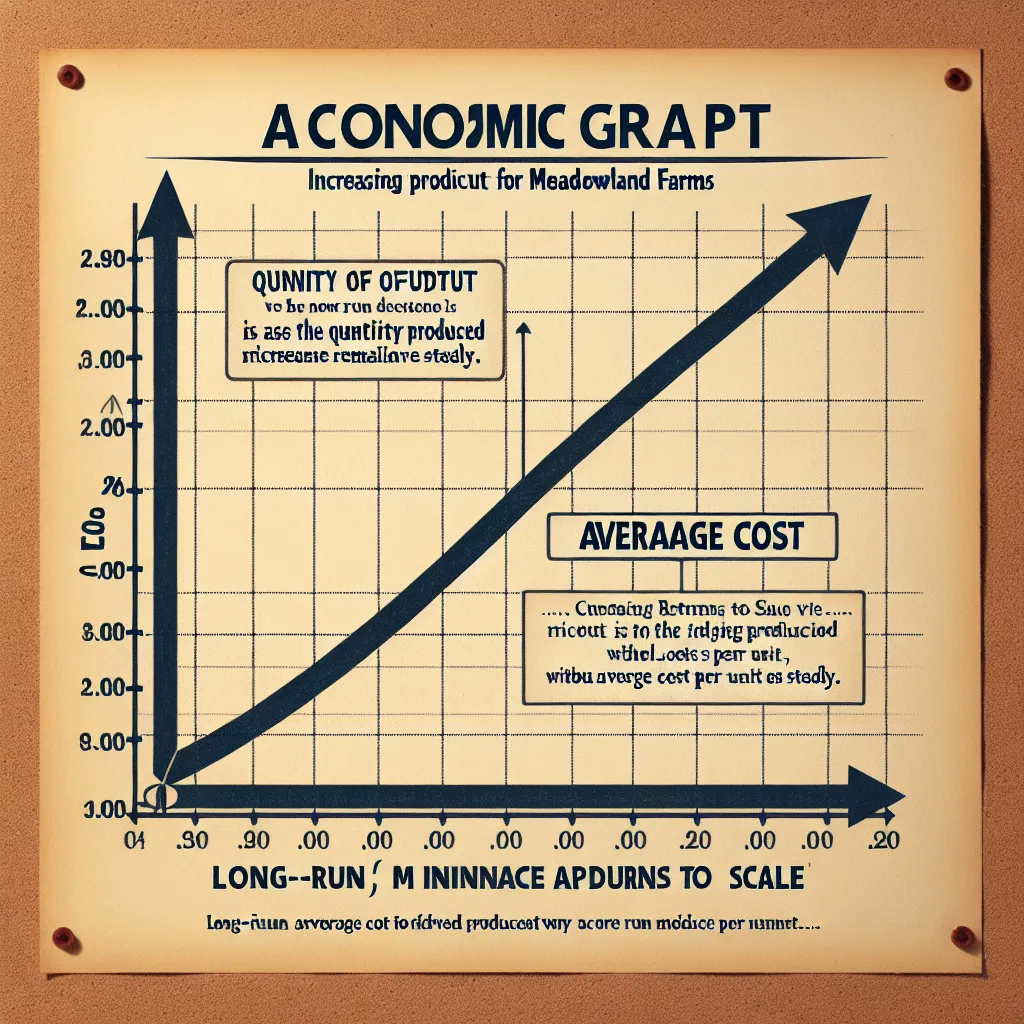
To identify the shape of Meadowland Farm’s long-run average cost (LRAC) curve, we must consider the given information: the farm's output precisely doubling the cost of production. This implies that the long-run average cost remains constant regardless of the level of output. In technical terms, when the doubling of output leads to doubling the cost, the firm experiences constant returns to scale. ### Explanation: **Constant Returns to Scale**: This occurs when increasing the scale of production results in a proportional increase in costs. In other words, if Meadowland Farms doubles its production, the total cost also doubles, so the average cost per unit remains unchanged. This makes the LRAC curve a horizontal line. ### Diagram: Below is a labeled graph illustrating the LRAC curve for Meadowland Farms under the assumption of constant returns to scale. \[ \begin{array}{c|c} \text{Long-Run Average Cost Curve} & \\ \includegraphics[width=0.5\textwidth]{graphs/lrac_constant_returns.png} & \begin{array}{l} LRAC: \quad \text{Long-Run Average Cost} \text{(constant at all output levels)} \\ Q_1, Q_2: \quad \text{Various Output Levels} \\ C: \quad \text{Cost per Unit (constant)} \\ O: \quad \text{Origin Point} \end{array} \end{array} \] ### Graph Description: 1. **X-Axis**: Represents the quantity of output produced (Q). 2. **Y-Axis**: Represents the cost per unit of output (C). 3. **LRAC Curve**: A horizontal line indicating that the long-run average cost stays the same regardless of increased production levels (constant returns to scale). 4. **Points Q1 and Q2**: Demonstrate different levels of output. At both these points, the average cost per unit remains equal at point C on the y-axis. ### Labels: - **Q1, Q2**: Different levels of production. - **C**: Constant cost per unit. - **LRAC**: Long-run average cost curve (horizontal line). ### Conclusion: Given that doubling output precisely doubles the cost of production at Meadowland Farms, the shape of the long-run average cost curve is horizontal, indicating constant returns to scale. This means that the long-run average costs remain unchanged as production increases or decreases, reflecting efficient resource utilization and stable costs per unit.
Think your answer is better than the AI's? Post it below.
Other Most Relevant Posts:
Question Tags
If you want your question answered by an AI, click here.


Post your own comment: