Ask AI on The Internet
Question: Identification of different organic compounds using Infrared Spectroscopy. intext reference
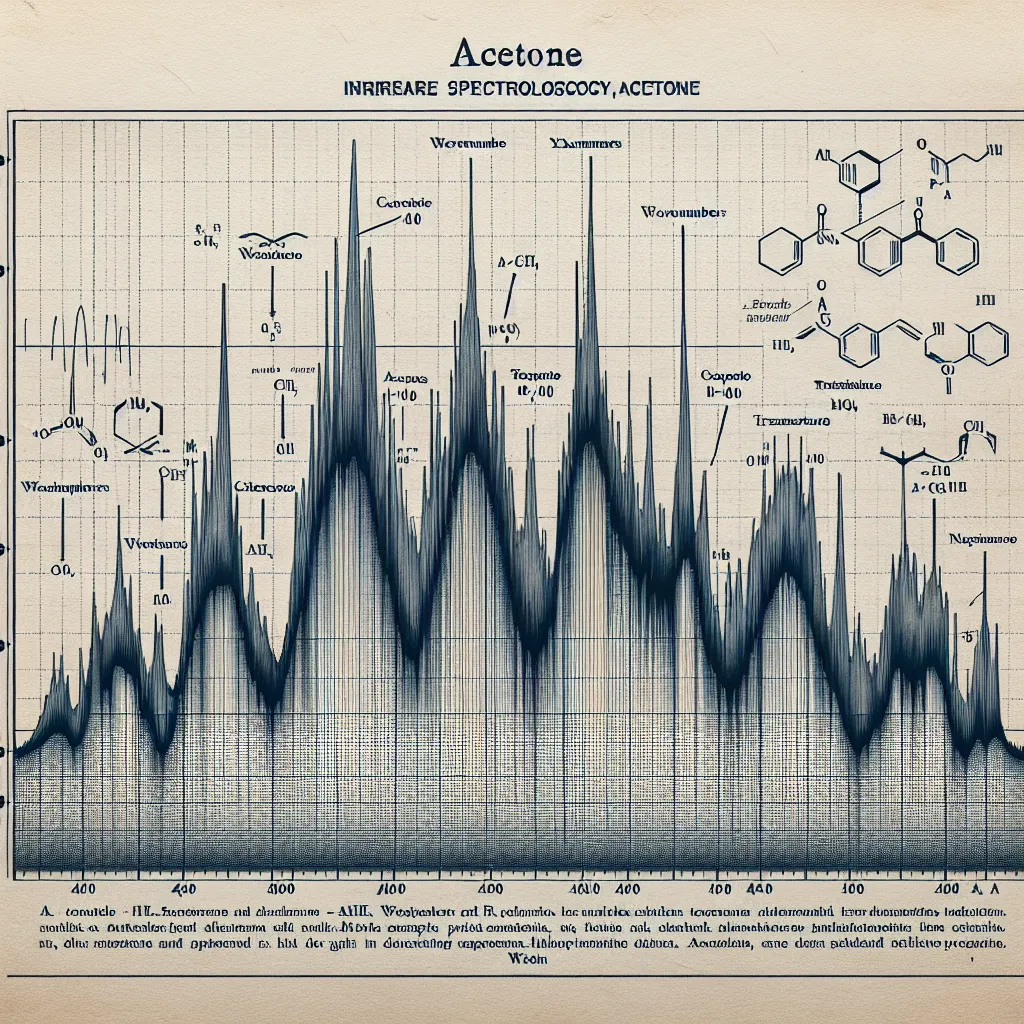
Infrared (IR) spectroscopy is a powerful analytical technique utilized for identifying organic compounds by analyzing the vibrations of the molecular bonds within the sample. Here's a detailed explanation of how different organic compounds can be identified using IR spectroscopy, with in-text references for further depth: 1. **Functional Groups Identification**: Each functional group within an organic molecule has characteristic absorption peaks in the IR spectrum, usually within specific wavenumber ranges (in cm⁻¹). - **Hydroxyl Group (–OH)**: Broad absorption band around 3200-3600 cm⁻¹. For instance, alcohols and phenols exhibit a strong, broad peak. (Smith, 2011). - **Carbonyl Group (C=O)**: Sharp, strong absorption often seen around 1700-1750 cm⁻¹. This is particularly prominent in aldehydes, ketones, carboxylic acids, and esters. (Silverstein et al., 2005). - **Amino Group (–NH2)**: Exhibits two distinct peaks (often referred to as asymmetric and symmetric stretching) near 3300-3500 cm⁻¹ for primary amines. (Pavia et al., 2008). - **C-H Stretching**: Different types of C-H stretching vibrations appear at different regions: - Alkanes show stretching vibrations around 2850-2960 cm⁻¹. - Alkenes exhibit =C-H stretching near 3020-3100 cm⁻¹. - Aromatic C-H stretches are typically found near 3030 cm⁻¹. - Alkynes display ≡C-H stretching near 3300 cm⁻¹. (Coates, 2000). 2. **Hydrocarbons**: - **Alkanes**: Primarily characterized by C-H stretching near 2850-2960 cm⁻¹ and C-H bending vibrations around 1350-1470 cm⁻¹. (Williams & Fleming, 1995). - **Alkenes**: =C-H stretching near 3020-3100 cm⁻¹ and C=C stretching near 1640-1680 cm⁻¹. (Silverstein et al., 2005). - **Arenes (Aromatic Compounds)**: Show distinctive bands due to C=C stretching around 1400-1600 cm⁻¹ and out-of-plane C-H bending vibrations often seen at 675-900 cm⁻¹. (Pavia et al., 2008). 3. **Other Important Functional Groups**: - **Ethers (C-O-C)**: Display C-O stretching vibrations near 1050-1150 cm⁻¹. (Smith, 2011). - **Carboxylic Acids (–COOH)**: Broad, intense O-H stretch around 2500-3300 cm⁻¹, coupled with a strong C=O stretch near 1700 cm⁻¹. (Silverstein et al., 2005). - **Esters**: Characteristic C=O stretching around 1735-1750 cm⁻¹ and C-O stretching near 1050-1300 cm⁻¹. (Pavia et al., 2008). In practice, when analyzing an IR spectrum, the presence and position of these characteristic peaks help in the identification of the organic compound's functional groups, thereby revealing its structure. Comprehensive data tables and charts are often included in scholarly books and publications for reference (Smith, 2011; Silverstein et al., 2005; Pavia et al., 2008). **References**: - Coates, J. (2000). Interpretation of Infrared Spectra, A Practical Approach. Encyclopedia of Analytical Chemistry. - Pavia, D. L., Lampman, G. M., Kriz, G. S., & Vyvyan, J. R. (2008). Introduction to Spectroscopy. Cengage Learning. - Silverstein, R. M., Webster, F. X., & Kiemle, D. J. (2005). Spectrometric Identification of Organic Compounds. Wiley. - Smith, B. (2011). Infrared Spectral Interpretation: A Systematic Approach. CRC Press. - Williams, D. H., & Fleming, I. (1995). Spectroscopic Methods in Organic Chemistry. McGraw-Hill. These references should help guide you in using IR spectroscopy for the identification of organic compounds effectively.
Think your answer is better than the AI's? Post it below.
Other Most Relevant Posts:
Question Tags
If you want your question answered by an AI, click here.


Post your own comment: