Ask AI on The Internet
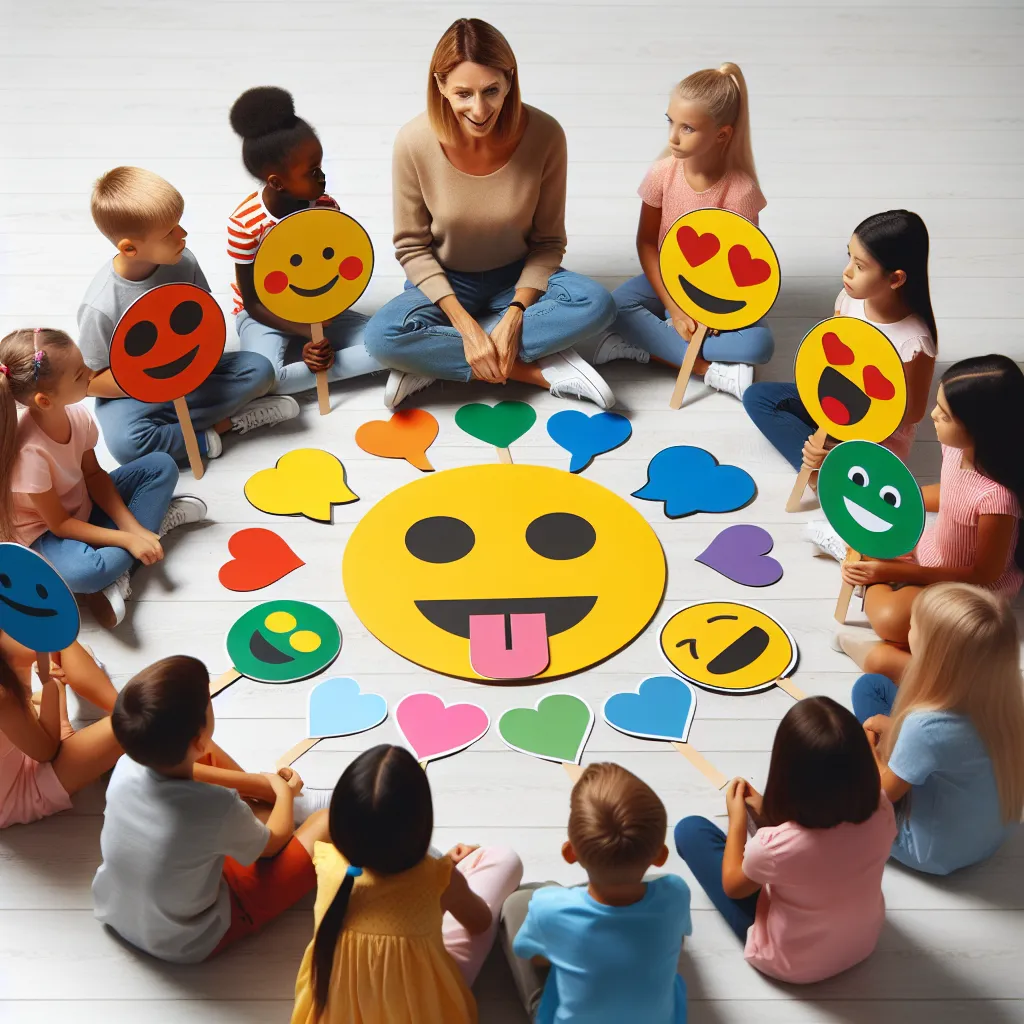
Question: Read the case study below, and then follow the instructions provided at the bottom: In Miss Mofokeng’s classroom, it’s circle time in the morning; the discussion is based on the theme of the week; “feelings”. Miss Mofokeng asks each child to pick out a face from the container full of cardboard cutout emojis that show how they feel that morning. The emojis show the following expressions: sad, happy, tired, excited, and worried. Miss Mofokeng now has twenty cutouts in the middle of the circle. 3.1. Suppose you are Miss Mofokeng; plan and involve learners in a data handling activity based on the case study above. In your activity, include • the problem statement/question (2) • present the activity using the steps of the data handling cycle. This should also include at least five questions in each step, as well as illustrations to guide the children in the process. (4x7=28) 3.2. After completing the activity in 3.1, answer the following questions: • Did the data-handling process solve the investigation? (1) • What went well? (2) • What would you do differently next time (remember, there is always room for improvement)?
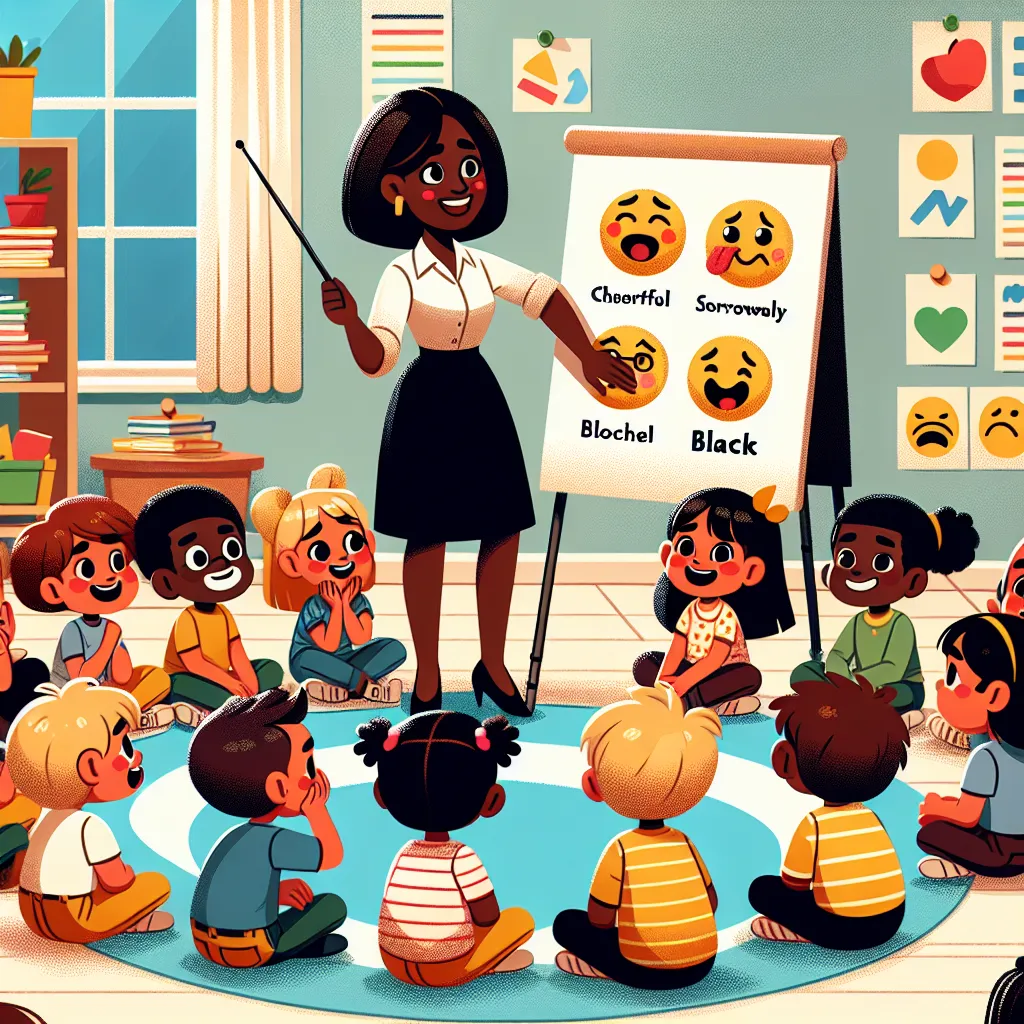
**Activity: Data Handling in Miss Mofokeng's Classroom** **Problem Statement/Question:** How do our feelings vary in the morning? **Steps of the Data Handling Cycle:** --- **Step 1: Collecting Data** 1. Each child will pick an emoji from the container and place it on the chart under the corresponding feeling. 2. Count the number of emojis for each feeling. 3. Is anyone missing or did any child pick more than one emoji? 4. Do we have any feelings not represented by an emoji today? 5. Make sure all children have a chance to explain why they chose their emoji. **Illustration for Collecting Data:** Create a large chart on the board with columns labeled "Sad," "Happy," "Tired," "Excited," and "Worried." The children place their chosen emoji under the appropriate column. --- **Step 2: Organizing Data** 1. How many children feel sad today? 2. How many children feel happy today? 3. How many children feel tired today? 4. How many children feel excited today? 5. How many children feel worried today? **Illustration for Organizing Data:** Transcribe the tally from the chart into a table: | Feeling | Number of Children | |----------|--------------------| | Sad | 3 | | Happy | 7 | | Tired | 4 | | Excited | 5 | | Worried | 1 | --- **Step 3: Representing Data** 1. How can we show our data in a picture (pictogram)? 2. Can we make a bar graph to show how many children have each feeling? 3. How about using a pie chart to represent the percentages of each feeling? 4. Which representation do you think is easiest to understand and why? 5. Can someone explain what our data tells us? **Illustration for Representing Data:** Create a bar graph with different colors for each feeling or a pie chart showing how the class's feelings are distributed. --- **Step 4: Interpreting Data** 1. Which feeling is most common today? 2. Which feeling is the least common? 3. Are there more children feeling happy or sad? 4. What might be some reasons so many children feel excited today? 5. How do our feelings today compare to yesterday if we have that data? **Illustration for Interpreting Data:** Discuss the results with the children and create a summary: "Today, most children feel happy. Excitement is the second most common feeling." --- **Step 5: Applying Data Interpretation** 1. What can we do to help our friends who feel sad? 2. Is there something special today that is making so many children feel excited or happy? 3. How can we help everyone feel better if they are worried or tired? 4. What activities can we do to maintain the happy and excited feelings? 5. Should we track our feelings for the rest of the week to see if there is a trend? **Illustration for Applying Data Interpretation:** Create a weekly tracking chart for feelings, and come up with activities or actions as a class to support classmates based on their expressed emotions. --- **3.2. Questions:** **Did the data-handling process solve the investigation?** Yes, the data-handling process helped us understand how the children felt that morning and provided insights into the emotional state of the class. **What went well?** 1. The children were actively involved in selecting and discussing their feelings. 2. The use of visual aids such as charts and graphs made the data easy to understand. 3. The activity encouraged empathy and support among the children. **What would you do differently next time (remember, there is always room for improvement)?** 1. Develop additional categories of feelings if necessary to provide a more comprehensive emotional range. 2. Incorporate follow-up activities that allow children to address and express changes in their feelings throughout the day. 3. Introduce a digital version of the chart to save time and increase engagement through technology.
Think your answer is better than the AI's? Post it below.
Other Most Relevant Posts:
 1. Types of Human Settlements
2. Advantages and Disadvantages of Urban Living
3. Challenges for Families in Urban Settlements
4. Importance of Self-Reflection for Grade R Teachers
5. Probing Ques
Question Tags
If you want your question answered by an AI, click here.


Post your own comment: